How To Use IL Disassembler (ILDASM)
After you've built and deployed an ASP.NET or ASP.NET MVC web application to an IIS web server and then it throws an exception, but the exception doesn't have any line numbers referring to your source code, how do you find where the error is?
I had such an exception message, it was telling me that "a reference wasn't set to the instance of an object." But of course it wasn't telling me which 'reference' it was referring to, but it did tell me the module, the method name, and it had a little plus sign and a number (like this +248) after the method name.
This number is a 'memory (byte) offset.' It tells you which binary instruction, or which byte, inside the method is throwing an exception. In my case the method had several lambda expressions, so the source code line number, not just the name of the method, would be useful to me to fix the problem.
I searched online for a way to figure out precisely where in my code that the +248 memory offset pointed to. I found out about a tool that was already included with Visual Studio 2010-2013 called ILDASM, or IL Disassember, and then I started figuring out how it worked and how to use it to find where my error was.
After an hour or so of playing with it I wondered why I had never used it before. So here are some 'quick and dirty' instructions on how to use ILDASM to find where an error is in your source code.
Step 1: Open ILDASM
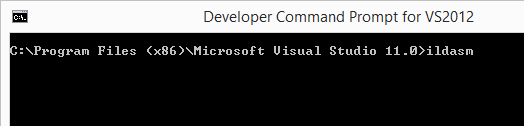
The ILDASM tool comes with Visual Studio, you'll need to find it, most easily by opening the Developer Command Prompt. On my computer is was in the C:\Program Files (x86)\Microsoft Visual Studio 12.0\ folder.
- From the Windows Start Menu, open a Visual Studio Developer Command Prompt
- Type ildasm
- Press Enter.
Step 2: Find Your Project Folder & The Compiled DLL
Find the compiled module with the source code the that's throwing the exception. The original module that is throwing the exception should have been compiled from the same source code, obviously they need to be the same.
- Build your project in Visual Studio.
- From ILDASM, click File
- Click Open
- Find your From my Visual Studio project folder. In the example my project folder is C:\Code\MinistryTools1\MapViewer.
- If your project built successfully the binary DLL files should be some where like the bin\Debug folder, sometimes it's different.
- Navigate through the tree representation of the module and find the class and method that is throwing the exception. You should recognize the structure of the assembly, it should match the structure of your project.

Step 3: Calculate The Offset Hex Equivalent
Calculate the byte offset from the exception message, that looks like +248,- Open Calculator
- Switch it to Programmers Mode
- Type the number in decimal
- Click the Hex radio button to convert it to hexadecimal.

Step 4: Find The Line Number From The Hex Offset
You'll need to turn on the feature that shows you the source lines.
- In the menu, click View
- Select Show source lines

- Double clicked on the tree node that matches the method name throwing the exception.
- A disassembled version of your code should appear in a windows that looks like this:

- Find the hex numbered line that starts with IL_, example: IL_0013, this is the hex memory offset.
- Look above the IL_ line for the source code line number. The source code lines are prefixed by two forward slashes and a six digit line number like this: //000062
Now you can find the line in Visual Studio and try fixing it.
Also
I have also seen that sometimes there is a clause that starts with .line 123,133 which tells you what lines the following commands belong to. I haven't figured out why that's necessary yet.